The main area consists of a browsable left panel (tree) that allows you to select configurations, and a right panel (content area) that provides detailed configuration information and available actions.
In the left panel, use the search box to quickly find specific plugins or configurations by typing their names. The tree filters instantly as you type. Click the X button to clear your search.
A selection of menus appears in the purple bar, allowing you to apply different views to the tree and configurations:
- When you display configurations by plugin name, you can quickly expand or collapse the entire tree.
- Click View All Configurations to see all configurations displayed on the right panel.
- You can view the items in the tree as follows:
- Group By Plugin Name—Displays the plugins as expandable folders with configurations.
- List by Configuration Name—Displays a flat, alphabetical list of all your configuration names without grouping.
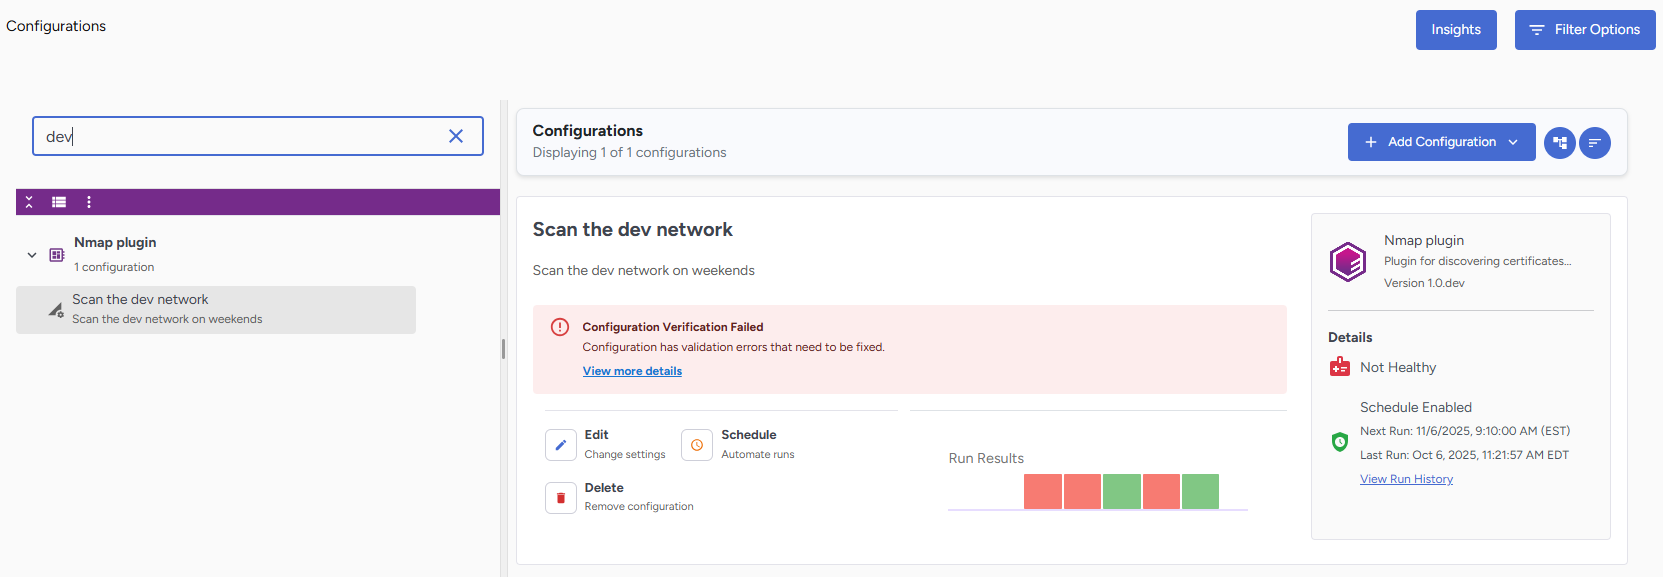
When a Configuration is selected in the Left panel, the right panel displays the complete details, including:
- Configuration name
- Description,
- Action buttons to perform operations
- If applicable, a small graph containing the run results of the last 5 runs.
Position your mouse over the separate items in the graph to view the run date and total results.
The gray box on the right shows the plugin's name, description, and version. Further details are listed below:
- The health status
- Schedule information,
- If the configuration was run, a View Run History link will provide more information on all completed runs.
You can perform the following tasks: