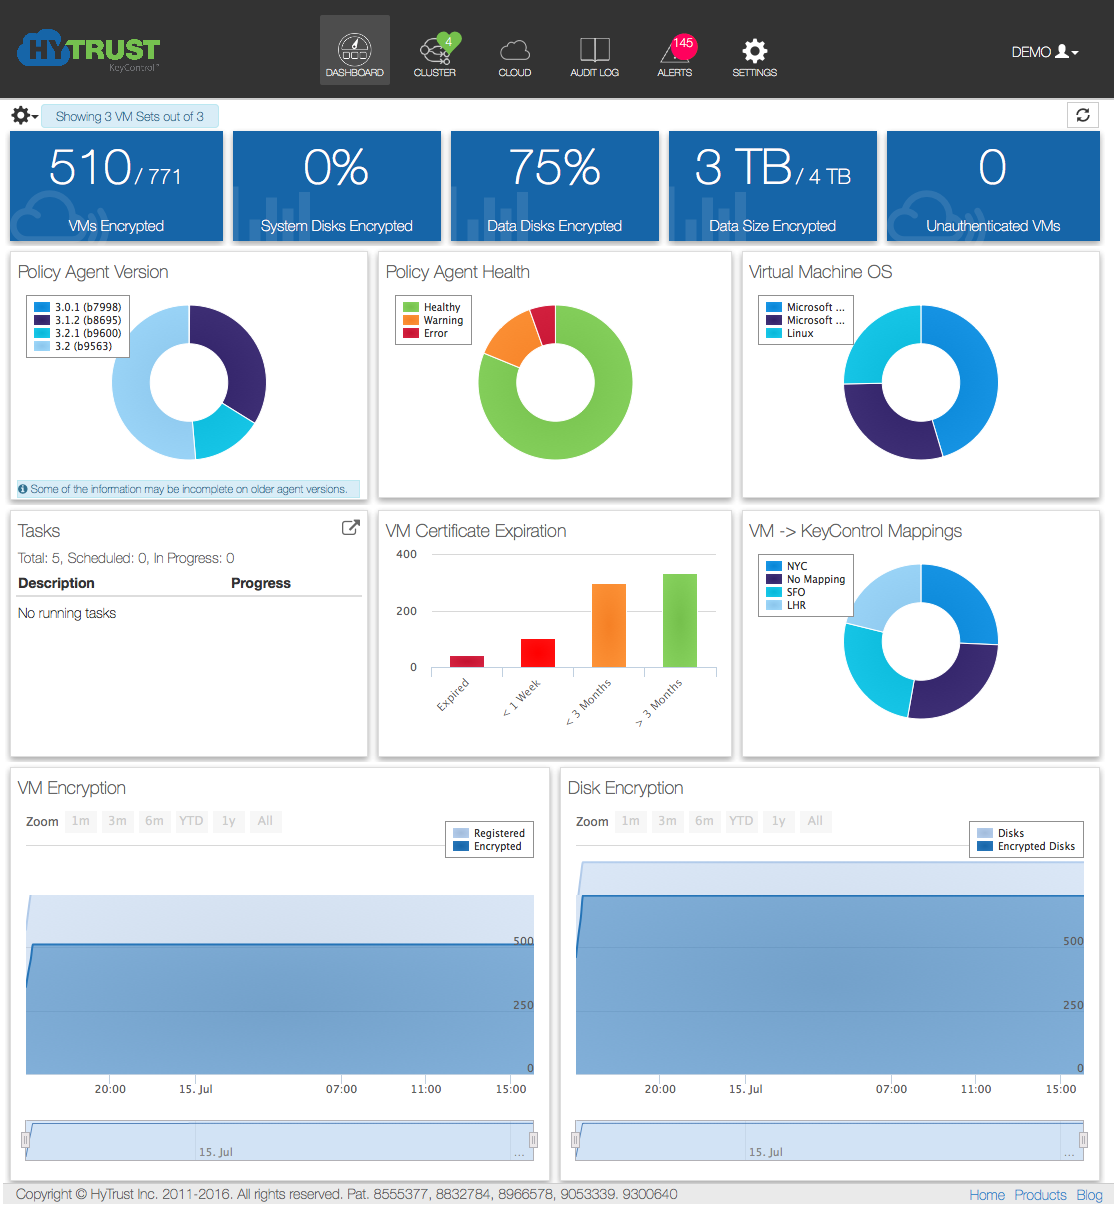
Clicking the Dashboard Icon brings up a graphic overview of your virtual machines, disks that are encrypted, and so on, as shown later in this guide.
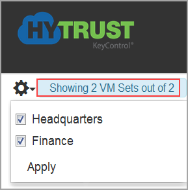
You can select which VM Sets you want to see statistics on, or you can choose them all, by clicking on the gear icon at the top of the table:
Once you have selected the VM Sets to review, you can then review them together, or zero in on any individual attribute.
You can view the following attributes:
The Dashboard then shows you graphical representations of each of the following topics:
With each chart, you can hover over sections of the chart, or click on sections of the chart itself to zero in on a more detailed view.
Here is the full Dashboard view: