Admin Access Dashboard
Use the Admin Access Dashboard to view the number of administrators per category in order to understand the distribution of access in the virtual environment applicable to the resources managed by CloudControl.
- In most cases, the admin category is assigned based on which category the user has the highest percentage of privileges. For example, if a user has 30% of the management operations available, but only one or two available in other categories, the user will be assigned as a Management Admin.
- Super Admin is assigned when a user has privileges for over 75% of the total number of operations in all categories.
- Power Admin is assigned when a user has privileges for over 25% of the total number of operations in at least two categories.
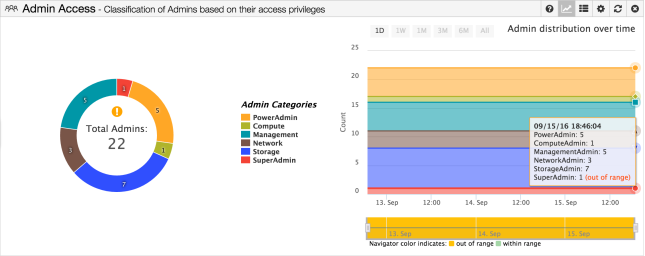
The donut chart represents all users with the privilege to perform admin operations in the current state, divided into six possible sectors. Admin operations involve managing the separation of duties by creating, updating, or deleting resources. Read operations are not considered when categorizing users. For more information, see Separation of Duties.
Four of the sectors are composed of users that primarily have privilege to perform admin operations involving one of the following resource categories:
-
Network resources
-
Management system resources
-
Compute resources
-
Storage resources
The two additional sectors involve multiple resource categories:
-
PowerAdmins: Administrators that primarily have privileges to perform admin operations involving resources in more than one resource category.
- SuperAdmins: Administrators mapped to a role that contains a full set of privileges (super-set) as defined by the vendor (VMware).
The administrator groups are calculated based on synching with the current Directory Service setup and the policy mapping enforced in CloudControl such as group-to-role mappings and rules created.
Sector size is defined by the percent of administrators that have been categorized to a particular administrator category. Labels on the sectors specify the number of administrators in that group.
The legend displays the color and group name for each type of administrator. Clicking on a sector will direct the user to the details panel that displays the list of adminstrators filtered by that sector’s resource group. For example, clicking the PowerAdmin sector of the donut chart shows the details about all the users in the PowerAdmin category.
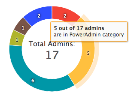
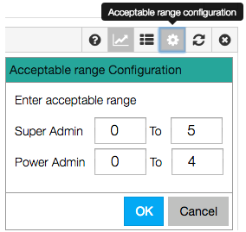
The configuration control for Admin Access Dashboard is the Acceptable Range Configuration. This allows the user to set the acceptable number of PowerAdmins and SuperAdmins. If the number of PowerAdmins or SuperAdmins is out of the specified range, the donut chart will have a (!) icon in its center — hovering over the icon displays the Out of range message.
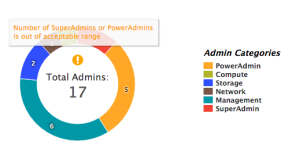
Administrator Count Out of Range – Current State
The donut chart displays the results from the most current Directory Service synchronization. In order to refresh this information, the user must trigger the synchronization by clicking the Start Directory Service Sync now refresh button. CloudControl prevents the synchronization event from running more often than 15 minutes in order to prevent the domain controller in Active Directory from being overwhelmed with queries from CloudControl.
Similar to scheduled compliance events, the Directory Service synchronization is a configurable scheduled event that can run with a frequency between every 15 minutes to once daily. However, if the CloudControl console is restarted or shut off, the Admin Access Directory Service is synced as soon as CloudControl is powered on again.
Trending
The trending graph shows the admin counts per category over time, where each line represents change in the number of admins in a particular category. The data begins from the time CloudControl was deployed or upgraded to 5.0.
The horizontal axis is date and the vertical axis is the count of admins per category. The legend in the center of the widget corresponds to the categories in both the current state (donut chart) and trending graph.
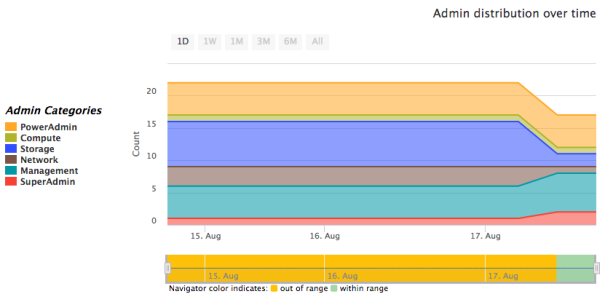
Trending Chart with Admin Count Out of Range
The Acceptable Range Configuration control allows the user to set a minimum and maximum number of PowerAdmin and SuperAdmin users. If, at a given unit of time, there are too few or too many PowerAdmin or SuperAdmin users, the navigator chart will be yellow. When the number of these users is within the specified range, the navigator chart will be green.
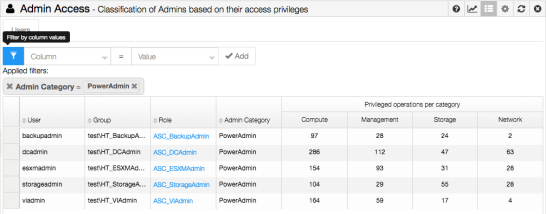
Details
The details panel shows each user, which groups the user belongs to, the roles assigned to the user, the admin’s category, and the user’s number of operations per admin category. The Privileged operations per category for each user are the unique operations per category. If a user is mapped to two roles, a particular operation is counted only once even if both roles have that operation.
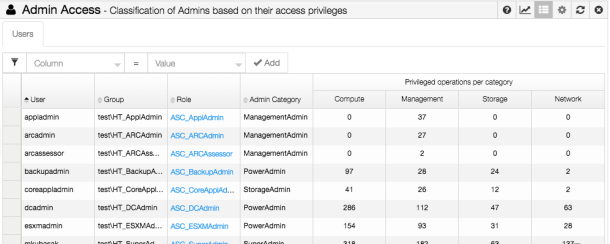
Admin Access Dashboard Details Panel
Clicking on a cell in the Role column will open up a new tab to the right of the Users tab, titled the name of the role. This tab displays the operations that are contributing to that user’s currently mapped admin category. Multiple Role panels can be added to the Admin Access Dashboard Details Panel at once, and can be exited by clicking the (x) on the tab.
The columns in each Role panel are:
-
Operation.
-
Vendor Name.
-
Privilege.
-
Operation Category.
-
Applicable Resource Type.
All columns can be reordered and sorted for easier data manipulation.
See Access Policies for more information on how users are mapped to groups in the directory service, and how policies are created on these groups.
|
Follow us: |

