Log Messages
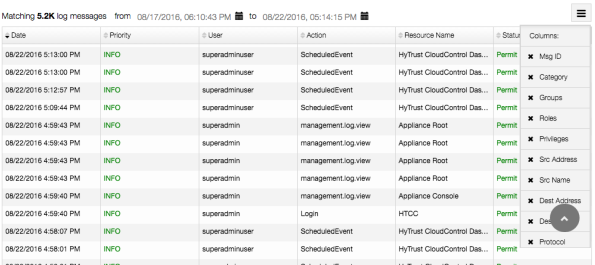
The Log Message table displays all messages (as restricted by filters) with the following default fields:
-
Date
-
Priority
-
User
-
Action
-
Resource Name
-
Status
Users can select which fields they would like as columns. All column options are displayed in the Table Options menu, on the top right corner of the grid. These fields match the Column Field options when creating filters.
Users can sort the table alphabetically in ascending or descending order, by clicking on any column header. Hovering over the date and time pickers above the table will display an option to show all messages or filter to the last hour, day or week. If a square on the heatmap has been clicked, the Log Message table will be filtered to that day.
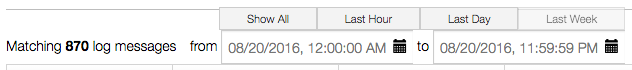
Log Messages filtered to 08/20/2016 + Filter by date options
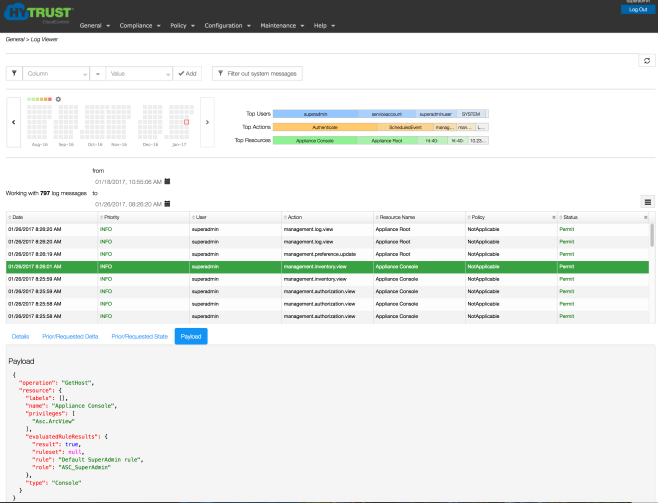
Each log message is condensed into the grid, but can be clicked on to expand. The detailed view shows all of the information for a log message, including the ones not visible in the table. To navigate away from the detailed log message, clicking the circular grey Scroll to Top widget brings the display back to the top of the Log Viewer page.
Clicking on a log message in the table will automatically scroll down the page to the Details area. To disable the auto-scroll, go to the table menu and deselect the "Auto-scroll to details" option.
A user can click on the log message tabs for more detailed information on Prior/Requested Delta, Prior/Requested State, and Payload data.
Figure:
|
Follow us: |

