Heatmap
The heatmap shows daily activity by representing the number of logs on a particular day with a colored square corresponding to high or low activity. Squares representing days are grey when there is no activity, and lie on a color gradient from green to red if there is any activity.
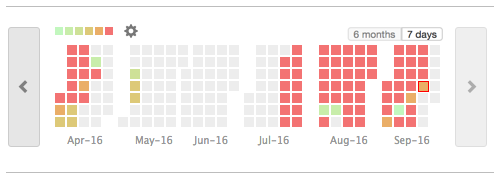
Heatmap View Mode
Click one of the following to change how you view the heatmap:
-
6 months—Displays six months at a time. Each cell is equivalent to one day, and the current day is outlined in red.
Hovering over a square in the heatmap will display the day of the week, date, and number of log messages recorded on that day, if any (as defined by the filters applied). Clicking on a square will update the leaderboard and log messages to display only the details for that specific day.
-
7 days—Displays seven days at a time. Each cell is equivalent to one hour, and the current hour (in 24-hour notation) is outlined in red.
Hovering over a square in the heatmap will display the hour, date, and number of log messages recorded in that hour, if any (as defined by the filters applied). Clicking on a square will update the leaderboard and log messages to display only the details for that specific hour.
Heatmap Legend:
The heatmap legend is available only when the view mode is set to 6 months. By default, the color gradient is spread out to represent a number of ranges:
|
|
To configure the heatmap legend:
-
Click the Settings icon and choose one of the following:
-
Use default legend - the provided out of box ranges will be used;
-
Use previous week - this option is available after CloudControl has been deployed for at least 7 days. If the user decides that previous week log counts are normal, he/she can choose this option and as a result new ranges will be generated for the legend.
-
Select "normal" range - the user can select any other date range that is at least 7 days long.
-
-
Click OK.
The heatmap colors change according to your selection.
|
Follow us: |

